Select units of measurement for the temperature and rainfall tables (metric or imperial).
Average weather, temperature, rainfall, sunshine hours

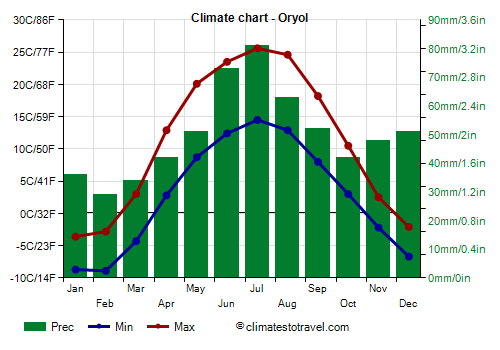
The climate of Oryol is
continental, with very cold winters and relatively warm summers.
Oryol is a city of 315,000 inhabitants, the capital of the oblast of the same name, located in Western European Russia, at almost 53 degrees north latitude. The capital, Moscow, is located 315 km (195 mi) to the north-northeast.
Precipitation is not abundant, since it amounts to about 600 millimeters (23.5 inches) per year. As often happens in cold climates, the rainiest season is summer.
Winter, from November to March, is very cold: the average temperature in January and February is around -6 °C (21 °F). The sky is often cloudy, and light snow often falls.
The ground is usually covered in snow, although there may be periods when the temperature rises above freezing, usually only slightly, and rain, drizzle or rain mixed with snow can occur.
During
cold spells, the temperature drops to around -20 °C (-4 °F) or below almost every year. Occasionally it can even drop below -30 °C (-22 °F), although this last happened in February 2006, with -34.5 °C (-30.1 °F).
The coldest record is -37.2 °C (-35 °F), set in February 1956.
The coldest month was January 1950, with a daily average of -17.7 °C (0.1 °F).
On the other hand, in the exceptionally mild winter of 2020, the daily average from December to February was -0.25 °C (31.5 °F), and the extreme minimum for the entire season was -15.8 °C (-3.6 °F), with only four days below -10 °C (14 °F).
Summer, from June to August, is quite warm, with an acceptable amount of sunshine, but also with fairly frequent rains and thunderstorms. The average in July is around 20 °C (68 °F).
Sometimes there can be
hot periods in which the temperature exceeds 30 °C (86 °F). The hottest record is 39.5 °C (103 °F), set in August 2010. The summer of 2010 was exceptionally hot, so much so that the average maximum temperature was 32.7 °C (90.9 °F) in July and 31.2 °C (88.2 °F) in August.
Oryol - Climate data
In Oryol, the
average temperature of the coldest month (January) is of
-6.1 °C, that of the warmest month (July) is of
20 °C. Here are the average temperatures.
Oryol - Average temperatures (1991-2020) |
| Month | Min | Max | Mean |
|---|
| January | -8.7 | -3.6 | -6.1 |
|---|
| February | -8.9 | -2.8 | -5.8 |
|---|
| March | -4.3 | 3 | -0.6 |
|---|
| April | 2.8 | 12.9 | 7.8 |
|---|
| May | 8.7 | 20.1 | 14.4 |
|---|
| June | 12.4 | 23.5 | 18 |
|---|
| July | 14.5 | 25.6 | 20 |
|---|
| August | 12.9 | 24.6 | 18.8 |
|---|
| September | 8 | 18.2 | 13.1 |
|---|
| October | 3 | 10.5 | 6.8 |
|---|
| November | -2.2 | 2.5 | 0.1 |
|---|
| December | -6.7 | -2.1 | -4.4 |
|---|
| Year | 2.7 | 11.1 | 6.9 |
|---|
amounts to
600 millimeters per year: so, it is at an intermediate level. It ranges from
29 millimeters in the driest month (February) to
81 millimeters in the wettest one (July). Here is the average precipitation.
Oryol - Average precipitation| Month | Days |
|---|
| January | 36 | 9 |
|---|
| February | 29 | 7 |
|---|
| March | 34 | 8 |
|---|
| April | 42 | 8 |
|---|
| May | 51 | 8 |
|---|
| June | 73 | 10 |
|---|
| July | 81 | 10 |
|---|
| August | 63 | 9 |
|---|
| September | 52 | 9 |
|---|
| October | 42 | 8 |
|---|
| November | 48 | 10 |
|---|
| December | 51 | 11 |
|---|
| Year | 600 | 107 |
|---|
There are on average around 2015
sunshine hours per year. Here are the average hours of sunshine per day.
Oryol - Sunshine hours| Month | Average | Total |
|---|
| January | 2 | 65 |
|---|
| February | 3 | 90 |
|---|
| March | 4.5 | 135 |
|---|
| April | 6.5 | 190 |
|---|
| May | 9 | 280 |
|---|
| June | 10 | 300 |
|---|
| July | 9.5 | 300 |
|---|
| August | 8.5 | 270 |
|---|
| September | 6 | 185 |
|---|
| October | 4 | 120 |
|---|
| November | 1.5 | 50 |
|---|
| December | 1 | 35 |
|---|
| Year | 5.5 | 2015 |
|---|