Select units of measurement for the temperature and rainfall tables (metric or imperial).
Average weather, temperature, rainfall, sunshine hours

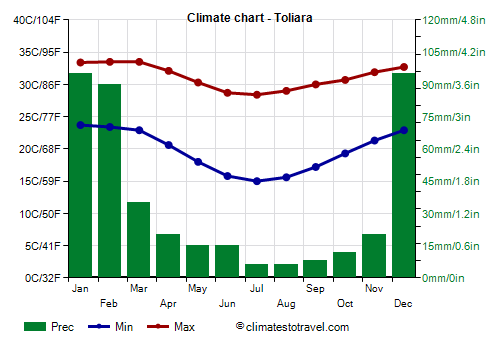
The climate of Toliara is
tropical arid, with a hot, rainy summer from December to March, and a long dry season the rest of the year, which becomes quite cool in winter, from June to August.
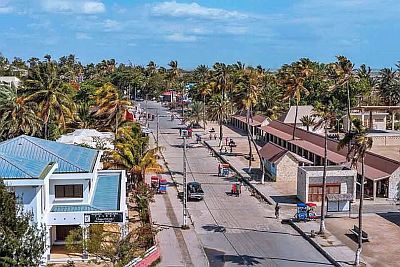
Toliara (or Toliary, formerly Tuléar), is a city of 170,000 inhabitants, located on the south-west coast of Madagascar, just north of the Tropic of Capricorn, in the Atsimo-Andrefana region, of which it is the capital.
Just north of the city is the mouth of the Fiherenana River.
Nearby, in the sea, is the
Grand Récif, a coral reef.
About 185 km (115 mi) to the northeast we find the
Isalo National Park, located in the interior, on a plateau whose altitude varies approximately from 500 to 1,250 meters (1,650 and 4,100 feet).

As mentioned, Toliara is located in the southwestern part of Madagascar, which is the
most sunny and arid of the country, but also the
hottest, especially in the southern hemisphere summer. In fact, from December to March the temperature can reach 38/40 °C (100/104 °F). In January 2022 it reached 42.3 °C (108.1 °F).
Fortunately, in summer the
southeast trade winds blow steadily, tempering the heat a bit.
Sometimes, however, it can get very hot even in spring, starting from mid-August, with highs above 35 °C (95 °F), and more rarely also in autumn.
Instead, in
winter, from June to August, the temperature drops more sharply than in the center-north of Madagascar, and nights are cool. In winter and spring, from June to September, and sometimes also in May and October, when cool air masses arrive from South Africa, the temperature can approach 10 °C (50 °F).
The temperature of the
sea drops to 23.5 °C (74.5 °F) in July and August, so, all in all, it remains warm enough to swim in even in the winter season.
Toliara - Climate data
In Toliara, the
average temperature of the coldest month (July) is of
21.4 °C, that of the warmest month (January) is of
28.3 °C. Here are the average temperatures.
Toliara - Average temperatures (1991-2020) |
| Month | Min | Max | Mean |
|---|
| January | 23.7 | 32.9 | 28.3 |
|---|
| February | 23.6 | 32.9 | 28.2 |
|---|
| March | 22.8 | 32.8 | 27.8 |
|---|
| April | 20.6 | 31.6 | 26.1 |
|---|
| May | 17.9 | 29.8 | 23.8 |
|---|
| June | 15.9 | 28.2 | 22 |
|---|
| July | 15.1 | 27.8 | 21.4 |
|---|
| August | 15.9 | 28.5 | 22.2 |
|---|
| September | 17.3 | 29.7 | 23.5 |
|---|
| October | 19.7 | 30.7 | 25.2 |
|---|
| November | 21.6 | 31.8 | 26.7 |
|---|
| December | 23.1 | 32.4 | 27.8 |
|---|
| Year | 19.7 | 30.7 | 25.2 |
|---|
amounts to
360 millimeters per year: it is therefore quite scarce. It ranges from
3.7 millimeters in the driest month (August) to
126.5 millimeters in the wettest one (January). Here is the average precipitation.
Toliara - Average precipitation| Month | Days |
|---|
| January | 126 | 7 |
|---|
| February | 90 | 6 |
|---|
| March | 41 | 3 |
|---|
| April | 10 | 1 |
|---|
| May | 12 | 1 |
|---|
| June | 8 | 1 |
|---|
| July | 4 | 1 |
|---|
| August | 4 | 1 |
|---|
| September | 5 | 1 |
|---|
| October | 9 | 1 |
|---|
| November | 15 | 2 |
|---|
| December | 35 | 4 |
|---|
| Year | 360 | 30 |
|---|
The
sea temperature ranges from
23.5 °C in July, August to
29 °C in February. Here are the average sea temperatures.
Toliara - Sea temperature| Month |
|---|
| January | 28.5 |
|---|
| February | 29 |
|---|
| March | 28.5 |
|---|
| April | 27.5 |
|---|
| May | 26 |
|---|
| June | 24.5 |
|---|
| July | 23.5 |
|---|
| August | 23.5 |
|---|
| September | 24 |
|---|
| October | 25 |
|---|
| November | 26.5"> |
|---|
| December | 27.5 |
|---|
| Year | 26.2 |
|---|
There are on average around 3595
sunshine hours per year. Here are the average hours of sunshine per day.
Toliara - Sunshine hours| Month | Average | Total |
|---|
| January | 10 | 310 |
|---|
| February | 9.5 | 270 |
|---|
| March | 9.5 | 300 |
|---|
| April | 9.5 | 290 |
|---|
| May | 9.5 | 295 |
|---|
| June | 9.5 | 280 |
|---|
| July | 9.5 | 295 |
|---|
| August | 10 | 315 |
|---|
| September | 10 | 305 |
|---|
| October | 10 | 315 |
|---|
| November | 10.5 | 315 |
|---|
| December | 9.5 | 300 |
|---|
| Year | 9.9 | 3595 |
|---|