Select units of measurement for the temperature and rainfall tables (metric or imperial).
Average weather, temperature, rainfall, sunshine hours

The climate of Vercelli is
moderately continental, with cold, damp winters and hot, muggy summers.
The city is located in northwestern Italy, in the Piedmont plain, on the banks of the Sesia River, and halfway between Turin and Milan.
Winter, from December to February, is cold, damp and gray. There are periods in which the temperature remains around freezing (0 °C or 32 °F) even in the daytime, especially in December and January, and the sky remains overcast for long periods.
Typically, by the second half of February, the temperature tends to increase, and highs exceed quite often 10 °C (50 °F).
Fog, which was once common, has become rarer, and is formed only in periods with Atlantic high pressure.
The wind is usually weak or absent, except when the
föhn blows, a warm, dry wind that comes down from the Alps and is able to bring clear skies and good visibility. When the föhn blows, the temperature can exceed 15 °C (59 °F) even in the middle of winter.
Snow in Vercelli usually falls at least once every year. On average, almost 30 centimeters (12 inches) of snow fall per year. In the great snowfall of 13-17 January 1985, 75 cm (29.5 in) of snow fell.
Every now and then,
cold air masses from Eastern Europe can bring quite intense frosts. The temperature rarely drops below -10 °C (14 °F), but in some situations, given that the cold air in Piedmont stagnates easily, it can reach very low values. The temperature has reached reached -23.4 °C (-10 °F) in February 1956 and -19.3 °C (-2.7 °F) in February 2012. These records make Vercelli one of the coldest cities in Italy.
 Summer
, from June to August, is hot and muggy, and generally sunny, at least in the morning. The heat is felt because of high humidity and poor to no wind.
Sometimes, an Atlantic front, able to bring cool and rainy weather, can affect this area even in summer; more often, on sunny days, thunderstorms can erupt in the afternoon or evening.
During
heat waves, which are becoming increasingly more frequent, the temperature can reach or exceed 33/34 °C (91/93 °F). Since Vercelli is located in a humid area, occupied by rice fields, temperatures remain lower than in other areas of Italy. In August 2003 and in July 2022, the temperature "only" reached 36 °C (97 °F).
Best Time
The
best period to visit Vercelli is that of spring and early summer, and in particular, from mid-April to mid-June. September, too, is a good month. However, you have to take into account some rainy days in both periods.
Summer can be hot, although some days can be acceptable, especially in June. In summer, and sometimes in May, sudden thunderstorms in the afternoon or evening must be put into account.
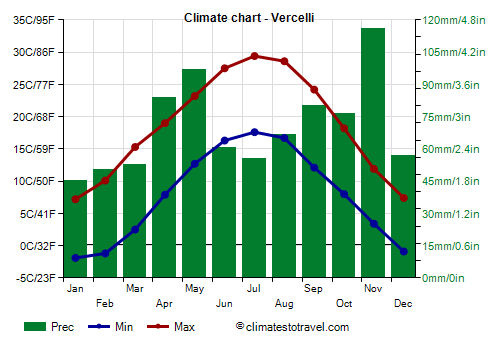
Vercelli - Climate data
In Vercelli, the
average temperature of the coldest month (January) is of
2.7 °C, that of the warmest month (July) is of
23.5 °C. Here are the average temperatures.
Vercelli - Average temperatures (1991-2020) |
| Month | Min | Max | Mean |
|---|
| January | -1.9 | 7.2 | 2.7 |
|---|
| February | -1.2 | 10.1 | 4.4 |
|---|
| March | 2.5 | 15.3 | 8.9 |
|---|
| April | 7.9 | 19 | 13.4 |
|---|
| May | 12.7 | 23.2 | 18 |
|---|
| June | 16.3 | 27.5 | 21.9 |
|---|
| July | 17.6 | 29.4 | 23.5 |
|---|
| August | 16.7 | 28.6 | 22.6 |
|---|
| September | 12.1 | 24.2 | 18.2 |
|---|
| October | 8 | 18.2 | 13.1 |
|---|
| November | 3.4 | 11.9 | 7.6 |
|---|
| December | -0.9 | 7.4 | 3.2 |
|---|
| Year | 7.8 | 18.5 | 13.15 |
|---|
amounts to
840 millimeters per year: so, it is at an intermediate level. It ranges from
45.4 millimeters in the driest month (January) to
116.1 millimeters in the wettest one (November). Here is the average precipitation.
Vercelli - Average precipitation| Month | Days |
|---|
| January | 45 | 5 |
|---|
| February | 50 | 4 |
|---|
| March | 52 | 4 |
|---|
| April | 84 | 8 |
|---|
| May | 97 | 8 |
|---|
| June | 61 | 6 |
|---|
| July | 55 | 5 |
|---|
| August | 67 | 6 |
|---|
| September | 80 | 6 |
|---|
| October | 76 | 7 |
|---|
| November | 116 | 8 |
|---|
| December | 57 | 5 |
|---|
| Year | 840 | 73 |
|---|
There are on average around 1810
sunshine hours per year. Here are the average hours of sunshine per day.
Vercelli - Sunshine hours| Month | Average | Total |
|---|
| January | 2.5 | 70 |
|---|
| February | 3.5 | 100 |
|---|
| March | 4.5 | 140 |
|---|
| April | 5.5 | 170 |
|---|
| May | 6.5 | 200 |
|---|
| June | 8 | 235 |
|---|
| July | 8.5 | 265 |
|---|
| August | 7.5 | 235 |
|---|
| September | 5 | 155 |
|---|
| October | 3.5 | 105 |
|---|
| November | 2.5 | 70 |
|---|
| December | 2 | 60 |
|---|
| Year | 5 | 1810 |
|---|